Introduction
This post describes my recent experience of getting ARM’s Instrumentation Trace Macrocell module outputting debug data to the terminal in PlatformIO.
One of the simplest and time tested means of debugging is via the veritable printf statement. Used by developers the world over to get a rough idea of whats going wrong….and what’s going right within their applications.
In embedded systems printf output is often directed over a serial link (UART). Problem solved I hear you say, printf for all!…..but what if all of the UARTS in your chosen controller are required by your particular application?
You could use a technique such as semihosting, offloading some functionality of your application, printf in this case to the machine running your debug tools. Although there are variations, semihosting typically works by having printf output directed to an in-memory buffer. When writing completes the debugger is informed (for example via a BKPT instruction on ARM processors). Allowing the debug tool to momentarily pause execution of your application, collect the contents of the buffer and resume execution. Debugging and logging over a single cable is pretty neat but can have a noticeable performance impact with higher volumes of log output.
Being faced with the no free UARTS on a customer project recently and not wanting to suffer the performance hit of semihosting I gave a feature of ARM processors I hadn’t used before a go.
ITM and SWO
ARM processors which feature ARM’s CoreSight Debug and Trace hardware provide a collection of hardware blocks which assist with debugging. Among these is a block called the Instrumentation Trace Macrocell (ITM), and another called the Serial Wire Output (SWO).
The ITM module amongst other features allows applications to emit trace data (software instrumentation events in ARM parlance) into first-in-first-out (FIFO) queue. From there the SWO module can be used to transfer the data out out of the processor and into the debugging host for display.
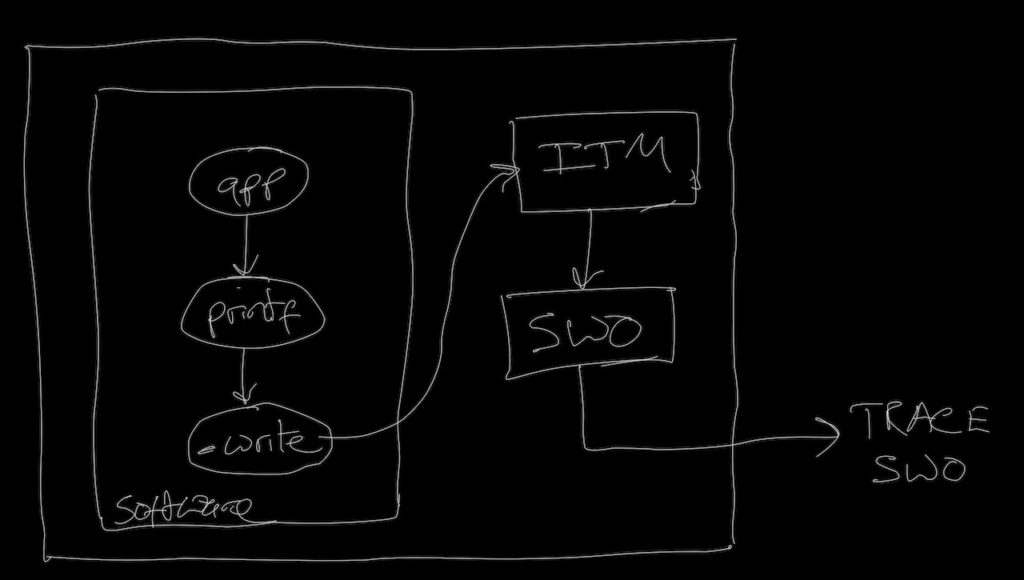
The flow with printf would therefore look something like this:
PlatformIO and ITM/SWO
At the time of running out of UARTs I was working on a customer project using PlatformIO. While I generally work on Linux or macOS they preferred to work on Windows so we needed a build system which could run on both platforms. I hadn’t used PlatformIO before but it appeared to fit the bill perfectly and has so far provided a seamless experience for me building on Linux and my customer building the same project on Windows.
In writing this post I’ve been testing on a generic STM32 “Blue Pill” development board featuring an ST-Microelectronics STM32F103C8T6 MCU.
Target Implementation
The first stage to getting printf working via the ITM module is to provide an implementation of the _write system call. When using the GNU Arm Embedded Toolchain the GCC compiler provided makes use of newlib as its standard C library. Newlib provides the implementation of printf, handling all the fiddly formatting operations before calling a function named _write to handle the actual printing of output to the terminal. It’s here in this function that you’d usually output to a UART of your choosing. In this case instead of feeding the characters to a UART we’ll be feeding them into one of the ITM modules ports (known as stimulus ports in ARM’s parlance).
While setting up a PlatformIO project for the blue pill, I opted to make use of the excellent LibOpenCM3 low level hardware library, providing drivers and definitions for the Cortex M3 along with the M0 and M4 processor lines. Thereby making access to the ITM hardware registers a breeze.
The _write function therefore ends up looking something like this:
/* System includes */
#include <errno.h>
#include <stdarg.h>
#include <stdio.h>
#include <unistd.h>

/* Hardware support */
#include <libopencm3/cm3/itm.h>
#include <libopencm3/stm32/dbgmcu.h>

/* Use ITM port 0 for printf messages */
#define ITM_STIM_PORT_PRINTF (0)

/* Implementation of _write for printf */
int _write (int fd, char *buf, int count)
{
	/* Only support stdout / stderr */
	if ((STDOUT_FILENO == fd) || (STDERR_FILENO == fd))
	{
		/* Check ITM and stimulus port enabled */
		if (	(ITM_TCR & ITM_TCR_ITMENA)
			 && (0 != ITM_TER[ITM_STIM_PORT_PRINTF])
		   )
		{
			/* Write to ITM port */
			for (int iIndex = 0; iIndex < count; iIndex++)
			{
				/* Enqueue byte in ITM FIFO */
				while (!(ITM_STIM8(ITM_STIM_PORT_PRINTF) & ITM_STIM_FIFOREADY));
				ITM_STIM8(ITM_STIM_PORT_PRINTF) = buf[iIndex];
			}
		}

		/* All data written */
		return count;
	}

	/* IO error, stdin / unknown stream */
	errno = EIO;
	return -1;
}
Here we check that the file descriptor provided is stdout or stderr, the two streams we can write to. If thats good we check that the ITM module itself is enabled as well as the stimulus port we intend to use for printf output (port 0 in this case). If all is well we write the provided buffer out to the stimulus port one byte at a time, waiting for buffer space before writing each byte.
Things to note here, both the ITM module itself and the particular port in use can be disabled. Using a traditional UART setup the debug output would typically be streaming out of the UART all the time, adding delays while waiting for UART buffer space. Here if there’s nothing listening the ITM module or port will be disabled and less time will be wasted sending data to nowhere. Some time will still be spent by printf formatting the data before _write discards it but more on that later.
The function above pretty much concludes the work required on the target.
Host Integration
For development I’ve been using an ST-Link V3 probe (although the V2 would work just as well).
I started with one of the Chinese clones which out of the box doesn’t support the required SWO line but can be made to with a small hardware mod. There are lots of resources available online describing how to gain SWO access on these clones.
Next we need to tell PlatformIO about our new debug setup.
This involves adding the following to platformio.ini:
[env:bluepill_f103c8]
platform = ststm32
board = bluepill_f103c8
framework = libopencm3

# CPU frequency (for use by ITM setup only, doesn't effect build)
board_build.f_cpu = 72000000

# ITM UART baud rate (supposedly supports upto 24Mhz in UART mode, however 2Mbps works reliably where as higher speeds sometimes dont)
board_build.f_itm = 2000000

# ITM debug - commands to enable and configure UART trace output on PB3 (SWO) at 2Mbps
debug_extra_cmds =
	monitor swo create pio_swo -dap stm32f1x.dap -ap-num 0
	monitor pio_swo configure -protocol uart -traceclk ${this.board_build.f_cpu} -pin-freq ${this.board_build.f_itm} -output :6464
	monitor pio_swo enable
	monitor itm port 0 on

# Have monitor connect to ITM port, provided by openOCD. While timestamping and filtering out undesirable characters.
monitor_port = socket://127.0.0.1:6464
monitor_filters =
	itm_swo	; Remove SWO headers from input
	default	; Remove typical terminal control codes from input
	time	; Add timestamp with milliseconds for each new line
The debug_extra_cmds property specifies additional commands for GDB to issue to the debug server (OpenOCD in this case) after its programmed and initialised the target.
Here we create a SWO object with the swo command. My understanding is that this is an OpenOCD concept, which informs it of the debug access port (DAP) that we’d like to make use of. Allowing a friendly name to be assigned (pio_swo in this case) that can be used for further configuration.
Next we configure the SWO interface, specifying that we’d like to use the UART protocol. An alternative being Manchester encoding, which supports higher frequency outputs. The ST-Link probes only support UART from what I could tell. We also specify the trace clock (the CPU clock) and the pin frequency (the SWO output pin frequency). For my M3 based board, thats 72Mhz and 2Mhz. Giving an output on the SWO pin at 2Mbps. Not as fast as the ST-Link manual clams the probe can support, it may be possible to tease it higher. Still a big step up from the typical 115,200bps UART debug. Finally we provide the port number we’d like a TCP server providing the SWO output to be hosted on, port 6464 here.
Finally we enable the DAP object and ITM port we’re using on the target to output the printf characters.
Information on the other options available here may be found in the OpenOCD documentation, search for “ARM CoreSight TPIU and SWO specific commands”.
The monitor_port property specifies the port which PlatformIO’s integrated serial monitor should connect to for debug output. While this is typically a serial port it supports the specification of a network host, here we connect to the TCP server hosted by OpenOCD on port 6464, which will provide the data arriving via SWO.
The monitor_filters property specifies a series of filters and text transformation modules which should be applied to the data arriving on the monitor port before being displayed on screen. The filters are chained together to form a pipeline, with each filter in the list receiving the output of the previous. The first filter in the list receives its input from the SWO TCP server. The output of the last filter in the list is displayed on screen. Time and default are builtin filters which timestamp and filter the output, they’re nice to have but optional. The itm_swo is a custom filter, implemented in python. Characters submitted to the ITM ports arrive at the host with a header containing the port number and data length to follow. The filter therefore processes and removes the headers, leaving only the data arriving from port 0.
The source of the itm_swo filter is as follows. It should be called “filter_itm_swo.py” and added to a directory named “monitor” in the project root, allowing it to be discovered and loaded by the serial monitor:
from platformio.public import DeviceMonitorFilterBase

# ITM SWO data format is described in ARMv7-M Architecture Reference Manual, Appendix D "Debug ITM and DWT Packet Protocol"
class ITM_SWO(DeviceMonitorFilterBase):
	NAME = "itm_swo"

	def __init__(self, *args, **kwargs):
		# Construct parent
		super().__init__(*args, **kwargs)

		# Reset current payload length
		self.payload_len = 0

	def rx(self, text):
		"""Process inbound data"""

		# Init output
		output = ""

		# Process input one character at a time
		for c in text:
			# Process character
			if self.payload_len > 0:
				# Payload bytes remain, pass through
				output += c

				# Decrement payload length
				self.payload_len -= 1

			else:
				# No payload remaining, read next header
				c = ord(c)
				self.payload_len = (c & 0x3) >> 0
				self.payload_src = (c & 0x4) >> 3
				self.itm_port = (c & 0xf0) >> 4

				# Sanity check header
				if self.payload_len != 1 or self.payload_src != 0 or self.itm_port != 0:
					# Reset payload, ignore this packet
					self.payload_len = 0

		# Provide processed output
		return output

	def tx(self, text):
		"""Process outbound data"""

		# Do nothing to transmitted data
		return text
The filter follows the protocol fairly basically (only expecting 8-bit outputs on the ITM ports), stripping the headers and outputting the data.
Usage
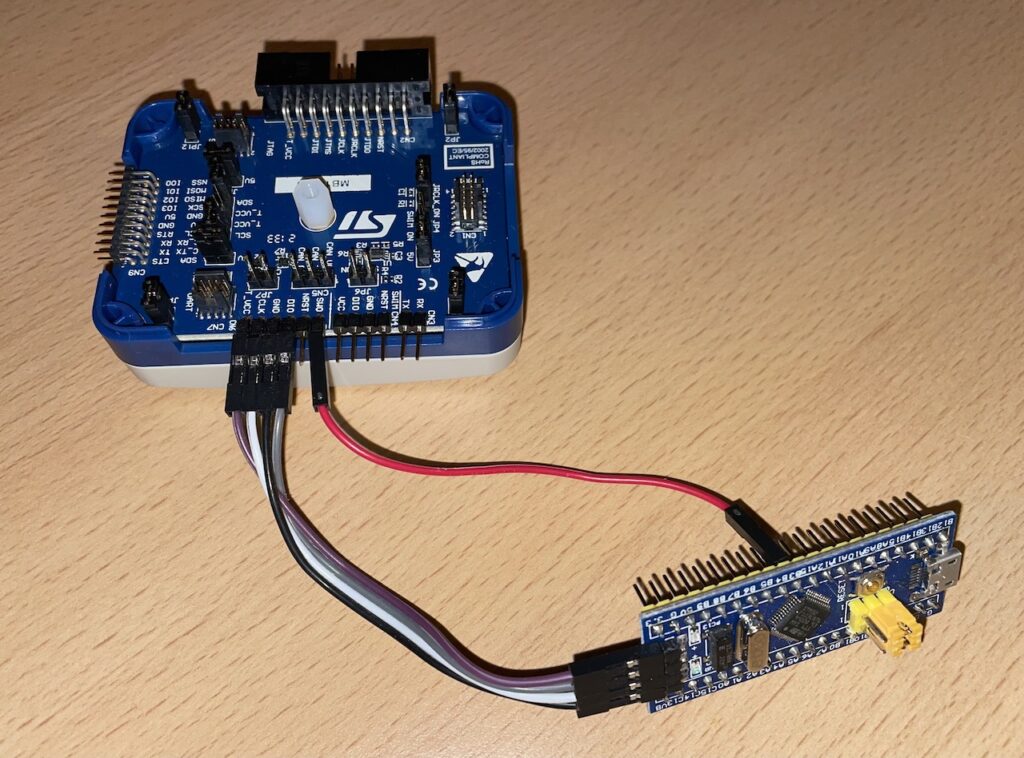
Once the target and host are configured as described above the final step involves connecting the SWO line from the target to the SWO input on your debug probe of choice. For the STM32F103 on my development board the SWO pin may be found on PB3.
Here’s my arrangement with the ST-Link V3 and Blue pill used for testing, SWO wire shown in red here:
With everything all hooked up simply start a debug session with PlatformIO and launch the Monitor. Using it from Visual Studio Code looks something like this:
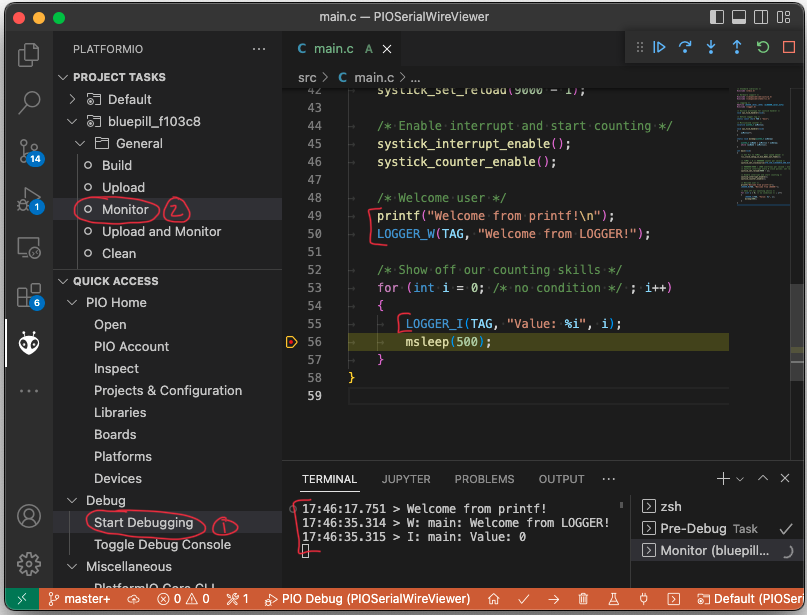
The only snag is “Upload and Monitor” is no longer functional as OpenOCD is only running for the upload phase and doesn’t stick around while the monitor opens.
The same goes for using the “Monitor” button without starting a debug session. Without a debug session in progress, OpenOCD isn’t running and therefore there’s nothing hosting the SWO TCP server configured requested by the monitor_port property in platformio.ini.
Beyond Printf
Having got our console output back with the help of the ITM/SWO modules, we can take another step, allowing potentially useful debug to be left in an application on a longer term basis.
In implementing the _write system call, we check that the ITM interface and port are enabled. Such that the output is only generated if there’s a device listening (or an external device that’s enabled the ITM module and port at least).
Unfortunately with the initial printf arrangement, the relatively expensive (in terms of processor time) string formatting will always be completed, before the _write system call potentially disposes of the output when it finds the ITM module or port disabled.
Inspired by the simple yet powerful logging library provided by Espressif as part of their esp-idf SDK, I’ve created an even simpler library. Making use of variadic macros and functions it provides a simple interface and consistent output format. Additionally delaying string formatting and output until the ITM interface is confirmed enabled, thereby reducing the overhead of logging when running without a debugger connected.
An example of its use:
/* Logging */
#define LOGGER_LOCAL_LEVEL (eLOGGER_Level_Info)
#include <logger.h>

/* Define logger tag */
static const char* TAG = "main";

static void SomeFunction(void)
{
    LOGGER_W(TAG, "Warning message from logger!");
}
Which generates the following output:
W: main: Warning message from logger!
A system wide log level may be defined (via defining LOGGER_LEVEL), as well as as a local logger level, applied to the current C file only (via defining LOGGER_LOCAL_LEVEL) as demonstrated above.
Macros are defined to output messages at the different log levels defined, for example:
LOGGER_V(TAG, "This is a verbose message");
LOGGER_D(TAG, "This is a debug message");
LOGGER_I(TAG, "This is a informational message");
LOGGER_W(TAG, "This is a warning message");
LOGGER_E(TAG, "This is a error message");
The macros accept a “tag” which will be output before the message, along with a printf format string and any additional arguments required for formatting.
Log statements which aren’t covered by the currently defined log level will be compiled out of the project.
The PlatformIO project developed for this post is available on GitHub.
Leave a Reply